Churn represents customers who stop using your product. The inverse metric—retention rate—measures the fraction of users who continue engaging with your offering over time. This matters fundamentally because churn directly impacts your bottom line.
The Cost of Churn
Consider this scenario: you acquire 20% more customers monthly while losing 20% of your existing base. Your growth stalls despite acquisition efforts. The math is unforgiving—you’re running to stand still, burning acquisition budget without net growth.
The alternative tells a different story. If you lose only 10% monthly while gaining 20%, you achieve 10% month-over-month revenue growth. Compound that over a year, and you more than double your customer base. The difference between these scenarios isn’t acquisition prowess—it’s churn control.
Every percentage point of churn improvement multiplies across your entire customer base. Reducing churn from 20% to 15% doesn’t just save 5% of customers—it transforms flat growth into exponential trajectory.
How to Measure Churn: Cohort Retention Analysis
Measuring churn requires cohort retention analysis, which breaks down into three essential components:
The Three Components
1. Cohorts
Divide users into groups based on signup periods. Group users who onboard during the same timeframe—for example, all users who signed up Dec 11-17, Dec 18-24, and Dec 25-31 become separate cohorts. This grouping lets you track retention patterns and identify which periods produce the stickiest users.
2. Critical Action
Define the behavior indicating active product use. For a LinkedIn automation tool, “customer paid subscription dues” works better than “logged in,” since users can set features to run passively without regular logins. Choose an action that genuinely reflects value extraction from your product.
3. Time Period
Align measurement frequency with your product’s expected usage patterns. Weekly or monthly intervals typically suffice for most SaaS products. Products with longer usage cycles—like tax software or Airbnb—require quarterly or annual observation windows.
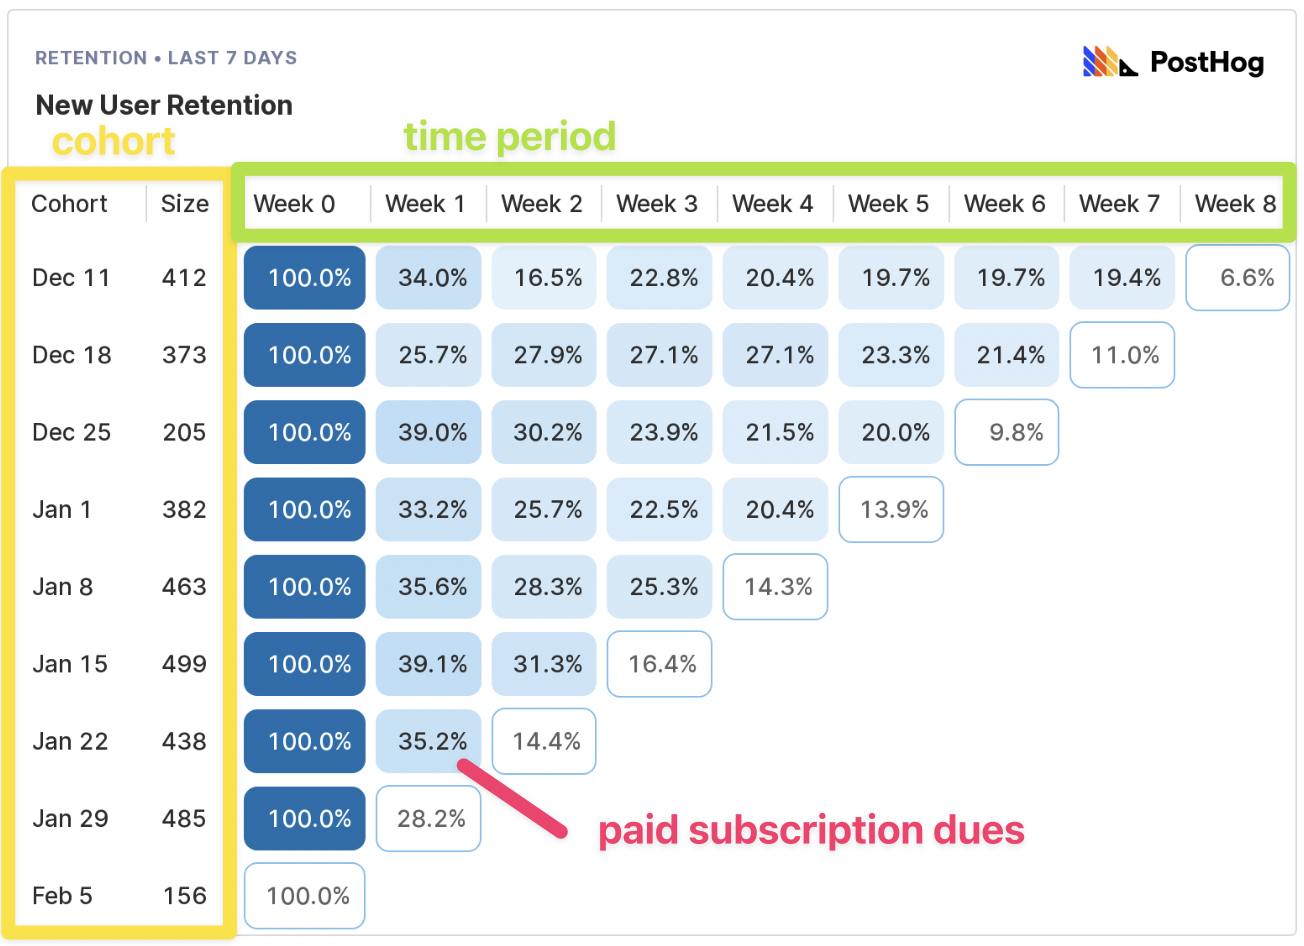
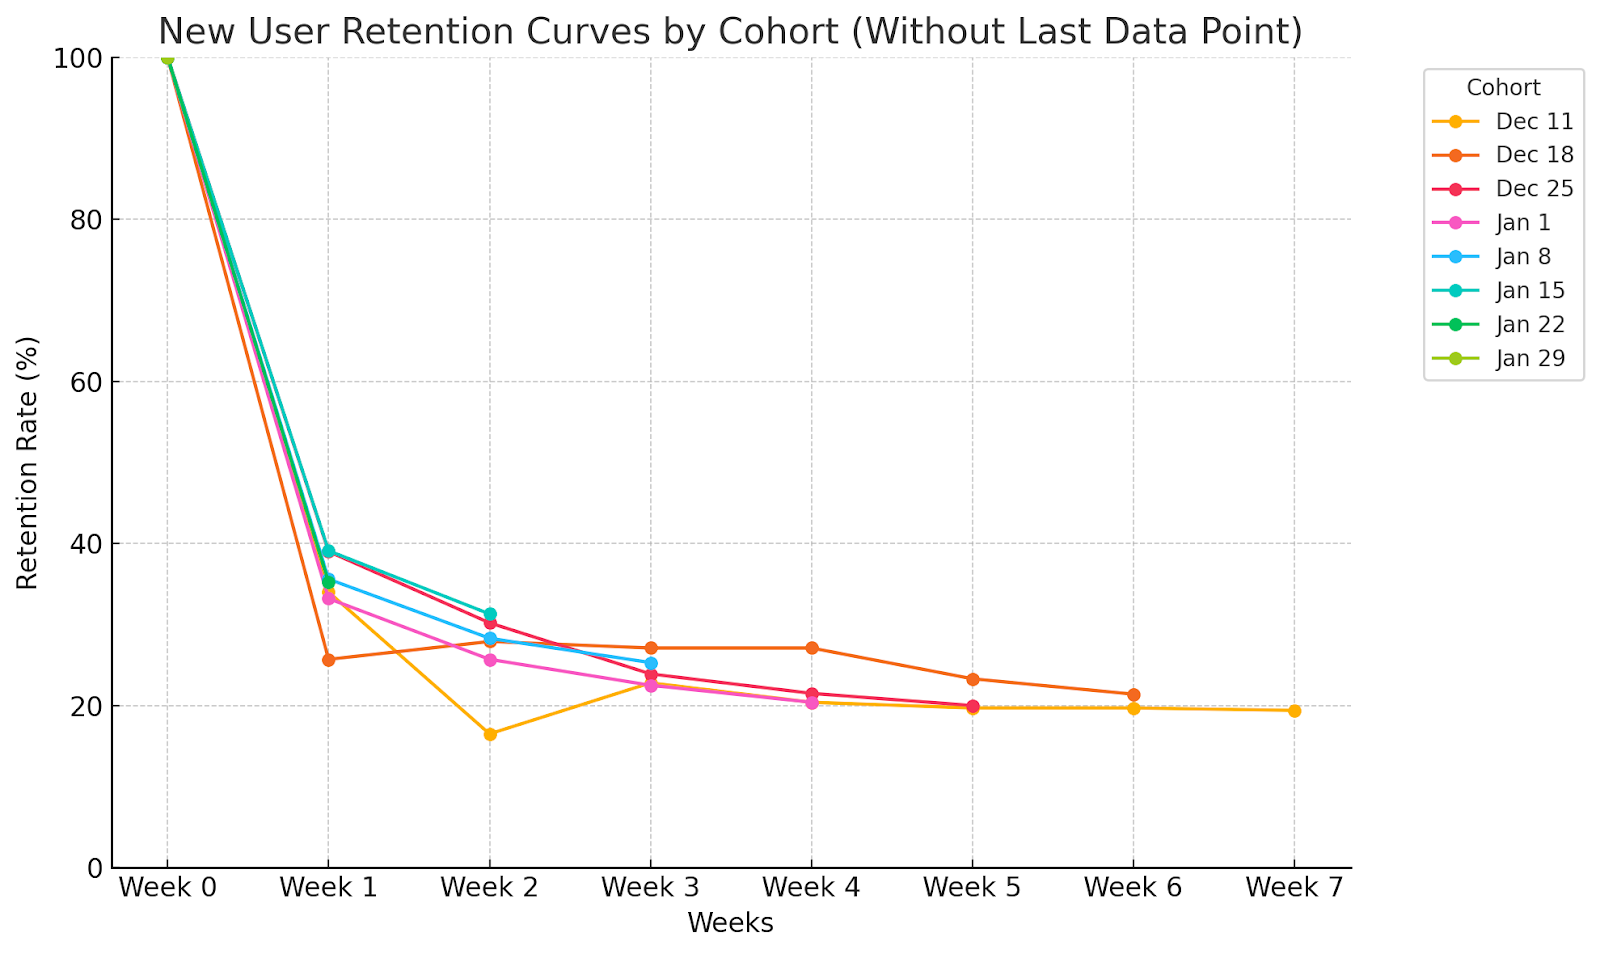
After establishing these parameters, analytics tools like Posthog can automatically generate cohort retention tables showing how user engagement evolves over time. The table reveals which cohorts retain best and when drop-offs typically occur.
Retention Benchmarks by Segment
Standards vary significantly by market segment:
| Segment | Target Retention | Why |
|---|---|---|
| Consumer subscriptions | 40% | Individual consumers have significant agency and low switching costs |
| SMB/startup customers | 60% | Switching involves organizational friction and setup costs |
| Enterprise customers | 70% | Operational complexity makes departures costly; integrations run deep |
These benchmarks represent solid performance. Exceeding them indicates exceptionally sticky product-market fit. Falling short signals fundamental issues with value delivery or user experience.
Strategies to Reduce Churn
Two foundational approaches address churn: setting accurate expectations and building features that naturally encourage retention.
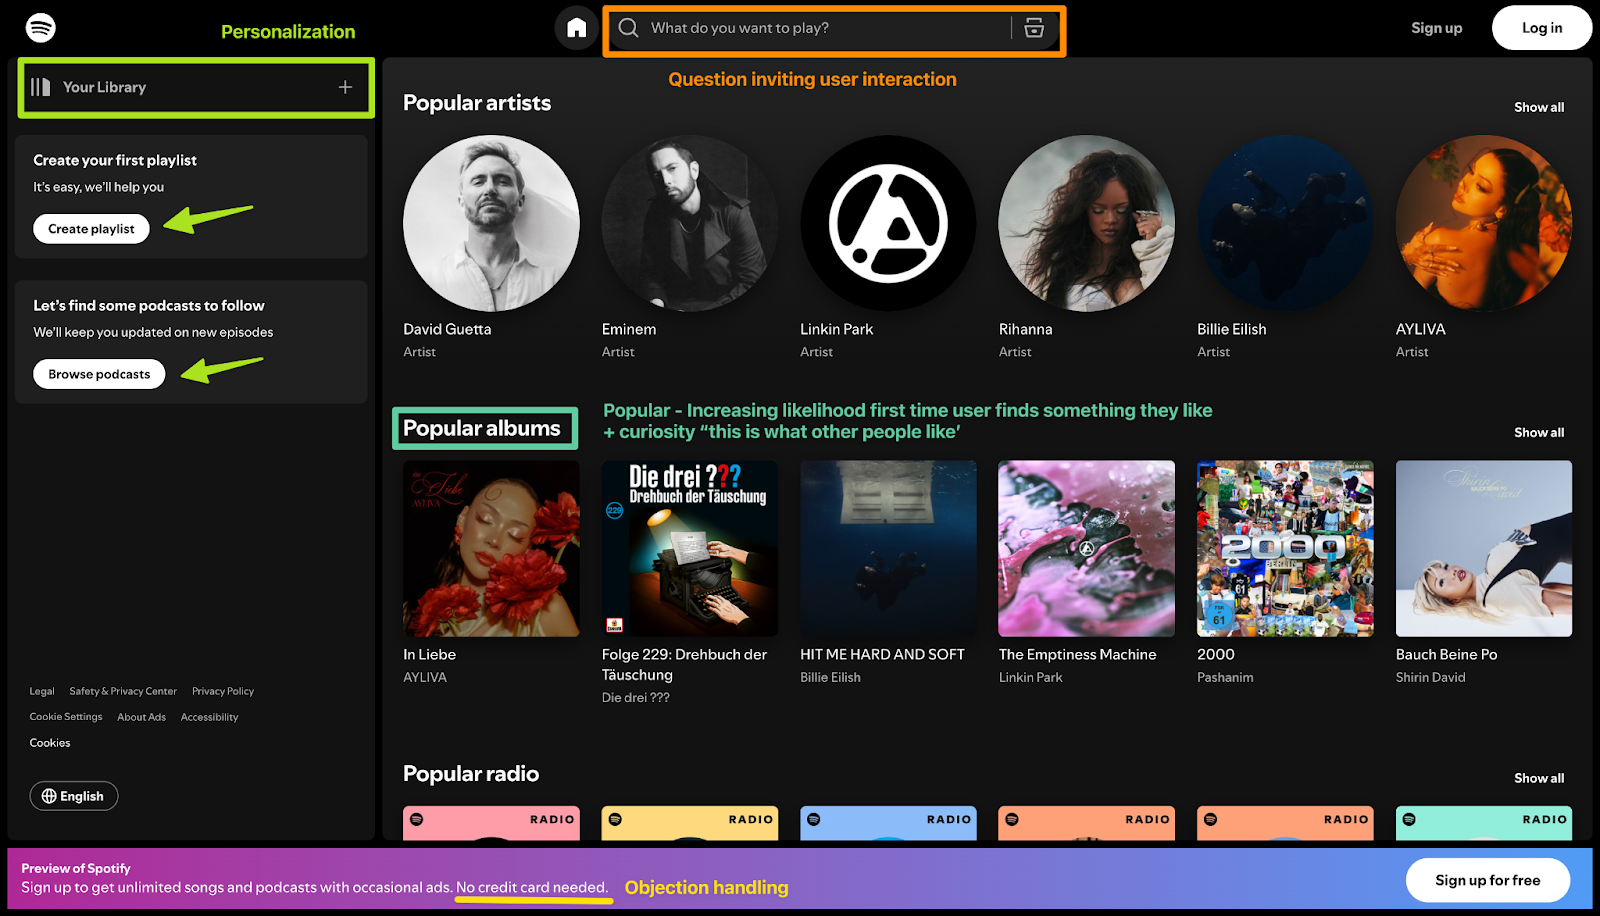
Align Your Messaging with Your Product
Mismatched expectations drive early departures. When customers discover your offering differs from marketing promises, they leave disappointed. You’ve wasted their time and your acquisition budget.
Think of a Thai restaurant advertising authentic cuisine but serving Americanized dishes. First-time diners expecting genuine flavors leave dissatisfied. The restaurant attracted the wrong customers—food enthusiasts seeking authenticity rather than casual diners wanting mild, familiar tastes.
Clear, honest messaging attracts appropriate users and reduces wasted onboarding efforts. If your product serves a specific niche, embrace that positioning. You’ll acquire fewer customers but retain more of them.
Develop Sticky Features
Features encouraging repeated use and raising switching costs improve retention. Six categories demonstrate particular effectiveness:
Integration with Existing Workflows
Seamless syncing with Google Calendar, Slack, or CRM systems makes your product indispensable within users’ daily routines. When your tool becomes embedded in their workflow, removing it requires retooling multiple processes. This operational friction creates natural stickiness.
Personalization and Customization
Allow users to tailor experiences. Netflix’s personalized recommendations create unique value that users grow attached to over time. The algorithm learns preferences through interaction history, making each profile increasingly valuable. Starting over with a competitor means rebuilding that personalized experience from scratch.
Data Accumulation
Storing valuable historical data creates migration friction. Accounting software demonstrates this principle perfectly—years of financial records, categorized transactions, and tax history represent significant accumulated value. Switching means either leaving that data behind or undertaking painful migration.
Network Effects and Community Building
Products increasing in value as user bases grow create natural stickiness. LinkedIn and Slack exemplify this principle—leaving means losing valuable connections. Your network stays on the platform, so you stay too. The larger your network within a product, the higher the switching cost.

Habit-Forming Features
Streaks, rewards, and challenges drive regular engagement. Duolingo’s daily goals and progress tracking embed the app into daily routines. Breaking a 200-day streak feels costly, even when the streak itself has no monetary value. Psychological investment creates retention.

Exclusive Content or Features
Proprietary tools users can’t access elsewhere create compelling reasons to stay. Adobe’s industry-standard creative suite demonstrates this principle—professionals depend on specific features and workflows that competitors don’t replicate. Switching means retraining and potentially compromising output quality.
Frequently Asked Questions
What is considered a good churn rate?
A good churn rate varies by market segment. Consumer products should aim for 40% retention, SMB/startup products for 60% retention, and enterprise products for 70% retention or higher. These benchmarks represent users who continue using your product over time—the inverse of churn rate.
How is churn rate different from retention rate?
Churn rate and retention rate are inversely related. Churn rate represents the percentage of users who stopped using your product, while retention rate represents the percentage who continue using it. If your retention rate is 70%, your churn rate is 30%. Both metrics measure the same phenomenon from opposite perspectives.
What is cohort retention analysis?
Cohort retention analysis measures churn by grouping users based on when they started using your product (e.g., all users who signed up in January), then tracking what fraction of each cohort continues performing a critical action over time. This requires defining cohorts, identifying a critical action that indicates genuine product usage, and selecting an appropriate measurement period aligned with usage patterns.
How often should I measure churn?
Measurement frequency should align with your product’s natural usage patterns. Daily-use products (like social media or productivity tools) should measure weekly or monthly churn. Weekly-use products should measure monthly or quarterly. Annual-use products (like tax software or seasonal services) need yearly measurement. Measuring too frequently creates noisy data; measuring too infrequently delays insights.
What are the most effective ways to reduce churn?
The most effective strategies involve building sticky features across six categories: integrations with existing workflows, personalization that improves over time, data accumulation that creates switching costs, network effects that increase value with user count, habit-forming features that drive daily engagement, and exclusive content unavailable elsewhere. Start by aligning your marketing messaging with actual product capabilities to set correct expectations from day one.
Key Takeaways
- Churn compounds over time—20% monthly churn means flat growth despite new customer acquisition, while 10% churn enables doubling annually
- Measure churn using cohort retention analysis: group users by onboarding date and track their critical action (the behavior indicating genuine product usage) over appropriate time periods
- Retention benchmarks vary by segment: 40% for consumer products, 60% for SMB/startup customers, 70% for enterprise—exceeding these indicates strong product-market fit
- Build sticky features in six categories: workflow integrations, personalization, data accumulation, network effects, habit formation, and exclusive content
- Align marketing messaging with actual product capabilities to set correct expectations and reduce early churn from disappointed users discovering mismatched promises
Understanding and reducing churn transforms business trajectory. SF AI Consultants helps companies optimize product experiences and implement retention strategies that protect existing revenue while scaling acquisition.
Dirk-Jan van Veen & Arthur Wandzel